NIFTY50
▲ LongOpen1W · 18 May 2026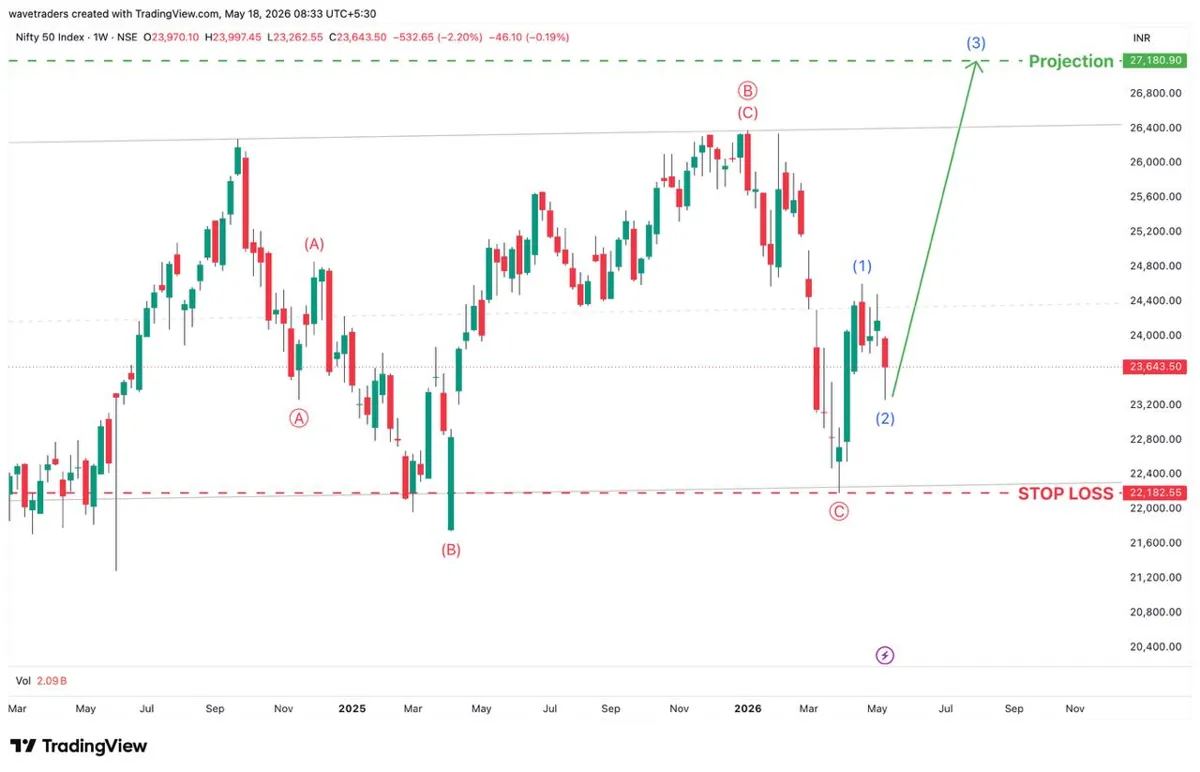
Entry
23,643.50
Stop loss
22,182.55
Target
27,180.90
Reward (R:R)
+2.42R
The analysis
Nifty 50 has held support at 22,182.55 and advanced from the entry at 23,643.5. This shows a bullish bias with the setup targeting a continuation of the uptrend toward 27,180.9. A drop below 22,182.55 would invalidate the view and signal a likely return to the downside.
The weekly chart shows a completed corrective sequence into wave C at the low, followed by an initial advance as wave (1) and a subsequent pullback as wave (2). This structure supports the expectation of further upside in wave (3) toward the projected level. The bullish count remains valid above the noted stop.
Wave count: (3)